Background on UNIX Memory Management
The IPSO kernel manages several pools of memory that can be allocated to either kernel functions or processes. The memory pools can be viewed with vmstat -z, which displays all of the Universal Memory Allocator zones. Each zone is constructed with a distinctive name, and statistics about the usage:
- Zone references by slab children
- Memory usage of the zone
- Number of total requests in the zone
There are children memory pools which are directly connected the zones, either by the kernel or running processes. They are called slabs. Every slab is a child of a UMA memory zone; the zone sets certain size restrictions on the type of memory pages that may be requested. The list of memory slabs may be viewed withvmstat -m . The reason to use memory slabs, is simply for efficiency. It is a much faster operation to create a slab of memory as a child of a pre-initialized UMA zone, than to create a memory zone from scratch. The UMA memory zones are children of a "primitive" structure called a Keg (outside the scope of this document, see references). This hierarchy of memory allocation is relevant because it can help you track down when a kernel virtual memory zone's used pages count is increasing and never going down. This is the definition of a memory leak within the kernel.
Memory within the children slabs or UMA zones is allocated on a page basis by the virtual memory manager. The size of these memory pages is fixed within the system, usually at 4kb. The IPSO memory allocator works by maintaining a set of lists that are ordered by increasing powers of two. Each list contains a set of memory blocks of its corresponding size. To fulfill a memory request, the size of the request is rounded up to the next power of two. A piece of memory is then removed from the list corresponding to the specified power of two and returned to the requester.
Thus, a request for a block of memory of size 53 returns a block from the 64-sized list. This sizing less than 4kb occurs within the 4kb slices that are allocated to a page; for example, consider that a memory operation is happening within a particular slab, and the requesting function needs 3 slots of memory, two for 512 bytes, and one for 2048 bytes. Since all of this can fit within a single virtual memory (VM) page, a single page could be used to store the data. The single VM page is allocated to a single requesting memory slab.
- Keg - Provides structural information about the memory allocation
- UMA Zone - Inherits information from a certain Keg structure, and further defines sizing and key attributes
- Memory slab - Inherits information from one or more UMA zones, and is linked to directly by the requesting task
Any modern operating system uses a Virtual Memory system to allocate memory space to the kernel and applications. This virtual system maps memory requests to contiguous address space, which maps to discontiguous physical page locations. The virtual memory handler is used to prevent resource exhaustion of physical memory. By tracking memory accesses and allocation/free operations, it is able to dynamically free up physical memory as needed by remapping a physical memory page to the disk media - this is called swapping. Swapping of memory is normal and happens all the time as part of memory management. However during standard operating conditions, a Check Point firewall should NOT swap.
A portion of the physical memory can be reserved as WIRED memory. Wired memory refers to memory pages that may not be swapped out of physical memory to disk. Often the main usage of Wired memory is for core kernel memory structures. Programs running on the system may request a certain percentage of their memory space to be reserved as Wired memory. The total memory allocations and usage may be viewed using the topcommand.
Most often this document will be used because there is a suspected memory leak on a system. The reason for assuming there is a memory leak, is that the system crashed. A system would crash because there was insufficient Free memory, and no other type of memory could be Freed (possibly too much was Wired, or the Virtual Memory system overflowed), and a new memory allocation for a core system function failed. In this instance it is normal for the system to crash or lock up.
After the system has been recovered with a hard power cycle, there are very few clues about what originally caused the problem. The logfiles most often could not be written to, because there was no memory available to initialize the function that would write the log. All crucial IPSO kernel counters available via ipsctl would be cleared on a system reboot. Finally, the top, vmstat, and ps output would also be cleared.
In the case where there is no available core file to analyze, an analysis must be done on the newly-booted system to determine if the problem is persistent and likely to occur again.
The Memory Leak Detection Script Accompanying this Document
The script accompanying this document is intended to help trace memory leaks and determine if there is indeed a memory leak present, so that the Check Point development team may be engaged to try and help narrow down the exact cause. The script by itself will only serve as instrumentation.
If the script is aborted or the system crashes before the script is done, the raw stats will still be present but the script must be hacked (by removing the data collection portion and all sections above it) and rerun to generate the final output.
Running the Memory Leak Detection Script
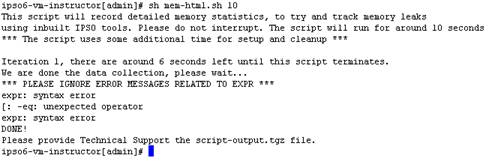
You must download and copy the mem-html.sh script to the target system. You may wish to read the script before executing it. Some important considerations are there it is very CPU intensive and may conceivably cause traffic loss on production systems. For typical operations it is recommended to run the script with the following syntax:
sh mem-html.sh 3600
This will execute the script, and run for approximately one hour – 3600 seconds. In the case where you are concerned with the CPU utilization of the script, you may run it with the following syntax:
nice +20 sh mem-html.sh 3600
The script will be executed with the lowest possible CPU priority on the system; however the results may be less accurate.
The script works by writing an HTML page and several subdirectories containing raw statistics. The raw stats are compiled and written in an abbreviated format to the HTML page as graphs and tables.
Script Output, Collected Before the Intensive Data Collection
The script will collect several important data and include them at the top of the document.
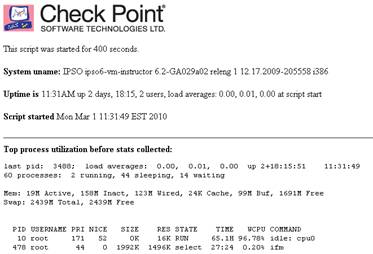
The basic information which is collected includes the duration of the script run, the kernel version, uptime, and date when the script was executed. The top output is also collected for later reference.
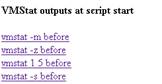
The vmstat outputs listed are collected before, and after, the script data collection.
Intensive Data Collection
Until the end timer is reached, the script will iterate through data collection using ps and top . This output is collected in the appropriate subdirectory.
Wrapping up the Data
Once the script's main loop is complete, the data is graphed within the HTML page using CSS. This is to assist the analyst by providing a historical plot of the memory utilization in megabytes.
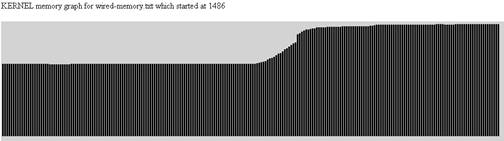
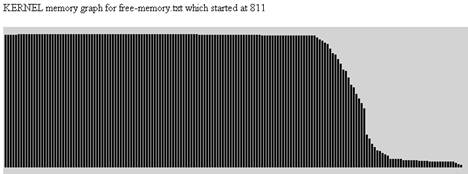
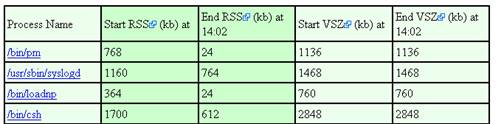
Tables are also created containing the start and end values of both kernel memory stats, and process memory stats. This allows the tracking of memory leaks both within the kernel space, as well as userland.
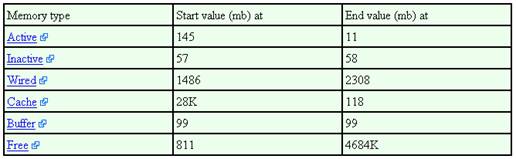
A leak in the kernel should be easily detectable by seeing the Free memory consistently shrink, and Wired memory growing consistently. There should be a corresponding growing Virtual Memory slab corresponding to the system function with the leak. Finally, the RSS for every process would drop as the virtual memory system tries to reclaim the least frequently used memory pages from the running processes.
A leak in a userland process would show similar behavior, except there would be a large increase in RSS and VSZ. The system *should* normally panic in these circumstances either when the processes reserved Wired memory increases beyond the available Free space, or the Virtual Memory address space is exhausted. It has been observed that a system may simply hang rather than panic and generate a core file.
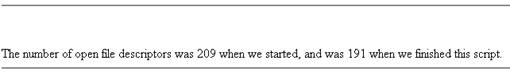
As a convenience to the analyst, the file descriptor allocations are also tracked via the script, since file descriptor leaks could also be interpreted as a memory leak.
All of the raw data that is used by the script is stored in the subdirectories so that the analyst may drop the results into an Excel and plot them.
Script Output
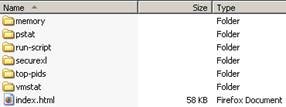
The resulting index.html and subdirectories are put into a script-output.tgz tarball, and the original files and directories are then deleted. The script-output.tgz must be collected and provided to Check Point TAC for analysis. Check Point will extract the contents of the tarball.
Analysis of the Memory Leak Detection Script
The analyst of the script output must consider several items:
- How busy is the system?
- The system may only leak memory when there is a lot of traffic
- Running the script during a maintenance window may not yield the desired output
- How long it has been up?
- A system could leak memory over very long timeframes - potentially weeks or months
- Has the memory gone up or down normally, or abnormally?
- A system will during a normal day request and release large amounts of memory
- "Abnormal" growth could indicate the problem, but it must be considered with everything else that is happening
- Where is the memory going?
- Depending on the uptime and how busy the system is, memory can be allocated to Wired, Inactive and process memory space in a way that looks wrong
- This is dependent on too many factors to worry about any one indicator
- Has the condition that triggered the memory leak occurred?
- A memory leak is usually triggered by a specific function that requests memory and never releases it. If this function doesn't execute, memory will not leak.
- It is important to run the script on the actual system that is leaking memory, or a proven replication
When running the script, please ensure that an appropriate duration is selected. Unless the memory leak is extreme, running the script for hours, days or weeks may be required.
Additional Tools
The following commands may prove useful when trying to track down memory leaks:
- top
- ps -auxwwlSHm
- vmstat -z
- vmstat -m
- vmstat 1 5
- vmstat -s
- top -mio -S -H
IPSO is compiled with an additional debug kernel. Since IPSO is FreeBSD-based, you can look up additional information about what the kernel flags are for. The additional flags that the kernel is compiled with, are:
- Witness
- Witness_KDB
- Witness_Skipspin
- Invariants
- Invariants_Support
- Diagnostic
- MBUF_Stamps
- KDB_Unattended
Choosing to run thiskernel.debug_g is extremely unwise unless directed to do so by Check Point engineering. One purpose of this debug kernel is to crash/panic when an error is detected, much more frequently than on a non-debug kernel. Therefore the kernel is very rarely provided to a customer and should rather be implemented in a lab where the error occurred.
Post a Comment