How to troubleshoot failovers in ClusterXL

Basic Information About the Failover Process

A failover occurs when a cluster member is no longer able to perform its designated functions, and another member in the cluster assumes the failed member's responsibilities.

In a Load Sharing configuration, if one cluster member goes down, its connections are distributed among the remaining cluster members. All cluster members in a Load Sharing configuration are synchronized, thus avoiding interrupted connections.

In a High Availability configuration, if currently Active cluster member in a synchronized cluster goes down, another cluster member becomes new Active member and "takes over" the connections of the failed cluster member. If state synchronization is not enabled, then existing connections are closed when failover occurs, although new connections can be opened.

In order to exchange the control information between cluster members (state of each member, state of interfaces, etc), the ClusterXL Cluster Control Protocol is used between cluster members (UDP port 8116). If a certain predetermined time has elapsed and no CCP messages are received from a given cluster member, it is assumed by other cluster members that the given cluster member has failed, it will be declared as Down and a failover might take place. At this point other cluster members automatically assume the responsibilities of the failed one.

Notes

  • A cluster member may still be operational, but if any of the above checks fail in the cluster, the faulty member initiates the failover because it has determined that it can no longer function as a cluster member.
  • More than one cluster member may encounter a problem that will result in a failover event. In cases where all cluster members encounter such problems, ClusterXL will try to choose a single member to continue operating. The state of the chosen member will be reported as Active Attention. This situation lasts until another member fully recovers. For example, if a cross cable connecting the cluster members malfunctions, both members will detect an interface problem. One of them will change its state to theDown, and the other will change its state to Active Attention.

A failover takes place when one of the following occurs on the active cluster member:

  • Any critical device (pnote) reports a problem (refer to the output of 'cphaprob -ia list' command).
  • The machine freezes / crashes (in this case refer to sk31511).

When a failing cluster member recovers:

  • In a Load Sharing configuration, all connections are redistributed among all Active members.
  • In a High Availability configuration, the recovery method depends on the configured cluster setting.
    The options are:
    • Maintain Current Active Gateway
      If one member passes on a control to a lower priority machine, then control will be returned to the higher priority member only if the lower priority member fails. This mode is recommended if all members are equally capable of processing traffic, in order to minimize the number of failover events.
    • Switch to Higher Priority Gateway
      If the lower priority member has control and the higher priority member is restored, then control will be returned to the higher priority member. This mode is recommended if one member is better equipped for handling connections (e.g., has more CPU power, more memory).

When a failed cluster member recovers, it will first try to download a policy from one of the other Active cluster members. The assumption is that the other cluster members have a more up-to-date policy. If this does not succeed, the recovering cluster member compares its own local policy to the policy on the Security Management server. If the policy on the Security Management server is more up-to-date than the one on the cluster member, the policy on the Security Management server will be retrieved. If the cluster member does not have a local policy, it retrieves one from the Security Management server. This ensures that all cluster members use the same policy at any given moment.

Troubleshooting the ClusterXL Failovers

To identify the root cause of the ClusterXL failovers:

In this step, we use several methods to understand what is causing the ClusterXL failovers.

  • SmartView Tracker - to filter all ClusterXL messages.
  • ClusterXL CLI - to understand the current status of the cluster members and the reason for that.
  • Analyze the Syslog messages which were generated at the time of the failovers.

Step 1: Using SmartView Tracker:

To facilitate analysis of what happens at the time of the failover, the relevant messages should be exported to a Text file, after modifying the filter:

To export the cluster messages in SmartView Tracker:

  • Go to the right-most column "Information"
  • Right-click on the name of the column
  • Click on "Edit filter"
  • Under "Specific" choose "Contains"
  • In "Text" type the word "cluster" (do not check any boxes)
  • Click on "OK"
  • Go to all the empty columns - "Source", "Destination", "Rule", "Curr Rule Number", "Rule Name", "Source Port", "User"
  • Right-click on the name of the column
  • Click on "Hide Column" (these columns will re-appear after closing and re-opening SmartView Tracker)
  • Save all the Cluster messages - go to menu "File" - click on "Export..."

Troubleshooting Method:

Open the exported file you have just saved, look for the ClusterXL messages during the time of the failover and see if there are messages indicating a problem of one or more critical devices (pnotes).

Examples - if you see problems on:

  • "Filter" critical device, most likely the policy was unloaded form that member, which caused the failover.
    Investigate and understand why the policy was unloaded form that member.
  • "Interface Active Check" critical device, it means that on one or more interfaces, CCP traffic was not heard on the specified default time configured. This can be a result of networking issues, high latency, physical interface problems, drivers, etc.
    Try to eliminate networking issues, drivers, etc. before you change something in the ClusterXL configurations.
    Use the ClusterXL Admin Guide for further help on this topic.

Step 2: Using ClusterXL CLI:

There are several commands that can help us to see the ClusterXL status. The most useful commands while a failover took place, are the following:

  • # cphaprob state
  • # cphaprob -ia list
  • # cphaprob -a if
  • # fw ctl pstat

# cphaprob state:

The following is an example of the output of cphaprob state from Load Sharing Multicast cluster:
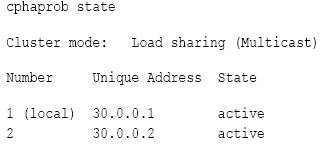
Cluster mode can be:

  • Load Sharing (Multicast)
  • Load Sharing (Unicast, a.k.a Pivot)
  • High Availability New Mode (Primary Up or Active Up)
  • High Availability Legacy Mode (Primary Up or Active Up)
  • For 3rd-party clustering products: "Service"

The number of the member indicates the Member ID in Load Sharing mode, and the Priority in High Availability mode.

In Load Sharing configuration, all members in a fully functioning cluster should be in 'Active' state.

In High Availability configurations, only one member in a properly functioning cluster must be in 'Active' state, and the others must be in the 'Standby' state.

3d-party clustering products show 'Active'. This is because this command only reports the status of the Full Synchronization process. For Nokia VRRP, this command shows the exact state of the Firewall, but not the cluster member (for example, the member may not be working properly, but the state of the Firewall is active).

Explanations on the ClusterXL members' status:

  • Active - everything is OK.
  • Active Attention - problem has been detected, but the cluster member still forwarding packets, since it is the only machine in the cluster, or there are no active machines in the cluster.
  • Down - one of the critical devices is having problems.
  • Ready -
    • When cluster members have different versions of Check Point Security Gateway, the members with a new version have the ready state and the members with the previous version have the activestate.
    • Before a cluster member becomes active, it sends a message to the rest of the cluster, and then expects to receive confirmations from the other cluster members agreeing that it will becomeactive. In the period of time before it receives the confirmations, the machine is in the ready state.
    • When cluster members in versions R70 and higher have different number of CPU cores and/or different number of CoreXL instances, the member with higher number of CPU cores and/or higher number of CoreXL instances will stay in Ready state, until the configuration is set identical on all members.
  • Standby - the member is waiting for an active machine to fail in order to start packet forwarding. Applies only in high availability mode.
  • Initializing - the cluster member is booting up, and ClusterXL product is already running, but the Security Gateway is not yet ready.
  • ClusterXL inactive or machine is down - Local machine cannot hear anything coming from this cluster member.

# cphaprob -ia list

When a critical device (pnote) reports a problem, the cluster member is considered to have failed. Use this command to see the status of the critical devices (pnotes).

There are a number of built-in critical devices, and the administrator can define additional critical devices. The default critical devices are:

  • Interface Active Check - monitors the cluster interfaces on the cluster member
  • Synchronization - monitors if Full Synchronization completed successfully.
  • Filter - monitors if the Security Policy is loaded.
  • cphad - monitors the ClusterXL process called 'cphamcset'.
  • fwd - monitors the FireWall process called 'fwd'.

For Nokia IP Clustering, the output is the same as for ClusterXL Load Sharing.

For other 3rd-party products, this command produces no output.

Example output shows that the fwd process is down:
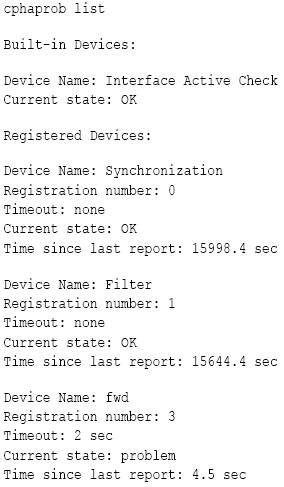
In these cases, check if 'fwd' process is up, using the following commands:

  • # ps auxw
  • # pidof fwd
  • # cpwd_admin list

If it is not up and running,you need to investigate why.

Check $FWDIR/log/fwd.elg file, try to locate the reason why the fwd process crashes.

Open a case with Check Point support to keep the investigation.

# cphaprob -a if

Use this command to see state of the cluster interfaces.

The output of this command must be identical to the configuration in the cluster object Topology page.

For example:
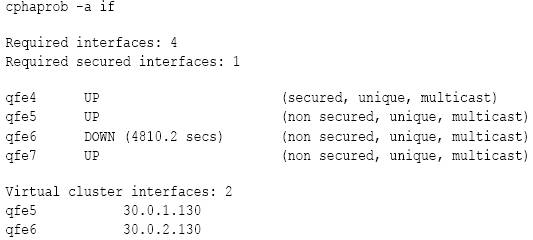
The state of interfaces is critical to operation of ClusterXL. ClusterXL checks the number of working interfaces at boot and sets a value of 'Required interfaces' to the maximum number of 'good' interfaces seen since the last reboot. If the number of working interfaces changes and becomes less, than the 'Required interfaces', ClusterXL initiates failover from this member to other members. The same applies to 'Required secured interfaces', where only the good synchronization interfaces are counted.

For 3rd-party clustering products, except in the case of Nokia IP Clustering, cphaprob -a if should always show cluster Virtual IP addresses.

When a state of an interface is DOWN, it means that the ClusterXL on the local member is not able to receive and/or to transmit CCP packets withing pre-defined timeouts. This may happen when an interface is malfunctioning, is connected to an incorrect subnet, is unable to pick up Multicast Ethernet packets, CCP packets arrive with delay, and so on. The interface may also be able to receive, but not transmit CCP packets, in which case the status field should be checked. The displayed time is the number of seconds that have elapsed since the interface was last able to receive/transmit a CCP packet.

See: "Defining Disconnected Interfaces" section - in the ClusterXL_Admin_Guide.

# fw ctl pstat

Use this command in order to get FW-1 statistics.

When troubleshooting ClusterXL issues, use this command in order to see the Sync network status and statistics.

At the bottom of this command output, are the Sync network statistics.

If that status is in "off", you will see the 'Synchronization' critical device reporting a problem, when running the# cphaprob -i list command.

That means that the Full Sync in the cluster (when a member is booting up or the cluster is configured) did not succeed.

In these cases, refer to the following SK articles:

Step 3: Analyzing Syslog Messages:

In Linux environment, like SPLAT, go to /var/log/messages files, and search for the time of the failover.

In Solaris environments, go to /var/adm/messages and search for the time of the failover.

Look for possible issues that can cause the problem - Link on interfaces going Down, lack of resources like CPU/memory, etc.

When opening Service Request with Check Point support, please attach all these messages to the case, and specify the exact time and date this issue happened, so we can correlate the failover with the logs.

Completing the Procedure

If after following the steps in this guide the failovers are not resolved, open a Service Request with Check Point and provide the following information:

  • CPinfo files from all cluster members (make sure to use the latest CPinfo utility installed per sk30567)
  • CPinfo file from the MGMT server (make sure to use the latest CPinfo utility installed per sk30567)
  • /var/log/messages* from ALL the cluster members --- please supply all the messages files in this directory
  • $FWDIR/log/fwd.elg* from ALL the cluster members --- please send all the fwd.elg files in this directory
  • $CPDIR/log/cpwd.elg* from ALL the cluster members --- please send all the cpwd.elg files in this directory
  • An export of all cluster messages from SmartView Tracker (see Step 1 above)

Backup procedures for Checkpoint

Check Point provides three different procedures for backing up (and restoring) the operating system and networking parameters on your appliances.

  • Snapshot (Revert)
  • Backup (Restore)
  • upgrade_export

Each of these procedures backs up certain parameters and has relative advantages (such as: file size, speed, and portability), which are fully described in this chapter, together with detailed instructions as to how to carry out each procedure.

Snapshot

The snapshot utility backs up everything, including the drivers, and is available only on SecurePlatform.
Snapshot can be used to backup both your firewall and management modules.
The disadvantages of this utility are that the generated file is very big, and can only be restored to the same device, and exactly the same state (same OS, same Check Point version, same patch level).

Snapshot via CLI on Open Servers

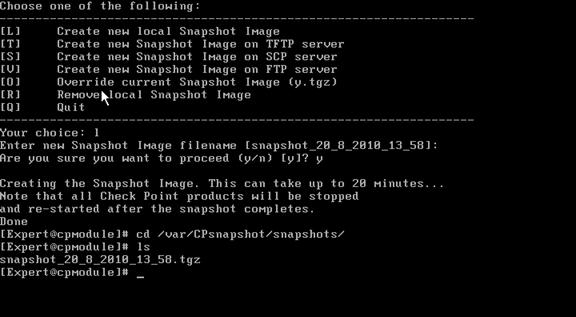
To take a snapshot via the command line interface (CLI):

From the command line, run snapshot

  • Running snapshot without any flags will use default backup settings and put the file in:/var/CPsnapshot/snapshots
  • You can use additional flags to designate a different file name, or select a TFTP/FTP server
  • Use snapshot -h for help or to list the flags

Note - Performing snapshot can take a long time and could interrupt your services. Thus, it is recommended to conduct a snapshot during a maintenance window.

Reverting to a snapshot

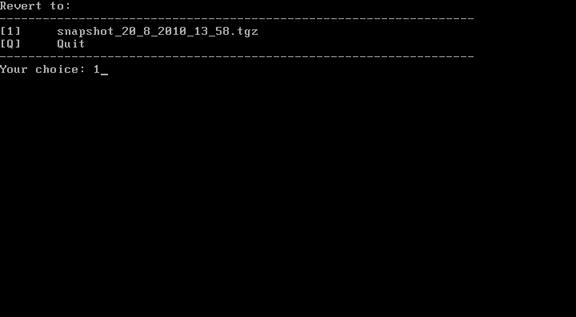
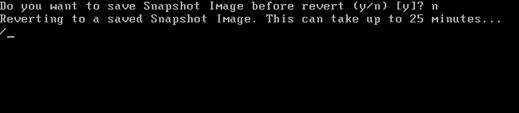
The revert command restores the system from snapshot file.

To revert to a snapshot:

From the command line, run revert

  • Use revert -h for help

Snapshot via WebUI on UTM-1 and Power-1 appliances

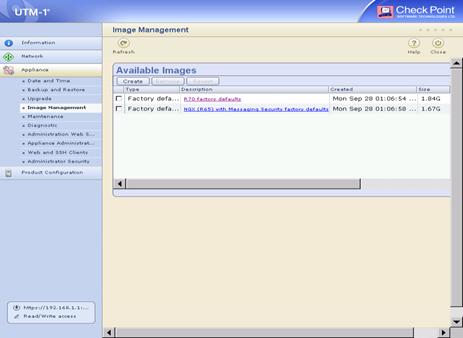
On the UTM-1 and Power-1 appliances the snapshot can only be performed from WebUI (not via CLI), and the file cannot be transferred to a different appliance.

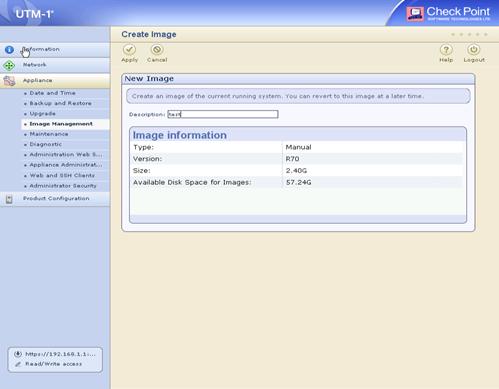
To create a snapshot via the WebUI:

  1. From your desktop open a browser and login to: https://:4434
  2. From the Appliance menu, select Image Management.

  3. Click Create. The Create Image window is displayed.

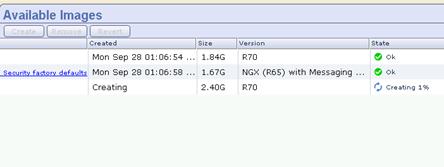
  4. Optionally, in the Description field, enter a description and click Apply. The status is displayed..

Reverting to a snapshot

Reverting on UTM-1 and Power-1 Appliances

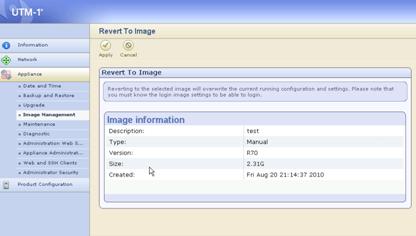
To restore the system to a previous snapshot:

  • Login to the same place, select the required snapshot and click Revert.

Backup

The backup utility backs up your Check Point configuration and your networking/OS system parameters (such as routing), and it is only available on SecurePlatform.

  • The backup utility can be used to backup both your firewall and management modules.
  • The resulting file will be smaller than the one generated by snapshot, but still pretty big.
  • Backup does not include the drivers, and can be restored to different machine (as opposed to snapshot, which cannot). However, it recommended using the backup for restore to the same machine since it includes information such us MAC addresses of the NIC interfaces.
  • You only can restore it to the same OS, same Check Point version and patch level.

Backup via CLI on Open Servers

To make a backup

From the command line, run backup

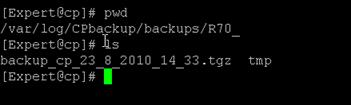
  • Running backup without any flags will use default backup settings and put the file in/var/CPbackup/backups

    Note - On UTM-1 and Power-1 appliances the location will be /var/log/CPbackup/backups

  • You can use additional flags to designate a different file name, or select a TFTP/FTP server
  • Use backup -h for help or to list the flags

Note - Performing backup can take a long time and could interrupt your services. Thus, it is recommended to conduct a backup during a maintenance window.

On open servers:

On UTM-1 and Power-1 appliances:

Restoring from a backup

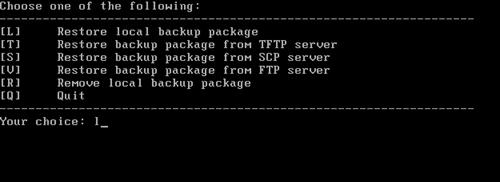
The restore command restores the system from backup file.

To restore from a backup:

From the command line, run restore

  • Use restore -h for help

Backup via WebUI on UTM-1 and Power-1 appliances

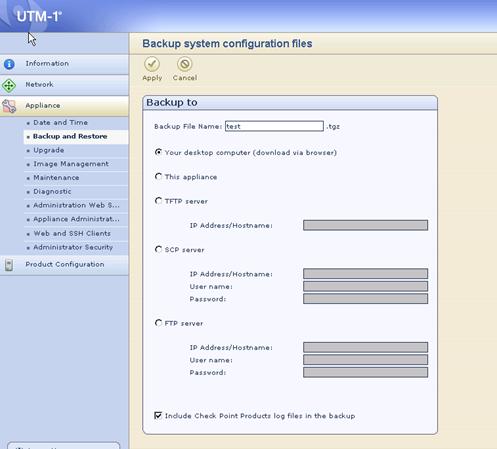
It is also possible to create backup from the WebUI interface.

To make a backup:

  1. From your desktop open a browser and login to:
    https://:4434
  2. From the Appliance menu, select Backup and Restore.

  3. Select a device from the option buttons shown and click Apply.
  4. You can either perform the backup now or you can create a schedule for a backup.

Note - Backup cannot be restored from the WebUI, only from the command line interface.

Upgrade_export and upgrade_import

Upgrade_tools backs up all Check Point configurations, independent of hardware, OS or Check Point version, but does not include OS information.
You can use this utility to backup Check Point configuration on the management station.
If you change the Check Point version you can only go up, in other words you can upgrade not downgrade.
The file will be much smaller (depending on the size of your policy), and if the system is not running on a highly loaded CPU you can do a backup on a live system without interruption of the services.
This utility can be used only on command line and cannot be scheduled.

On SecurePlatform and Linux

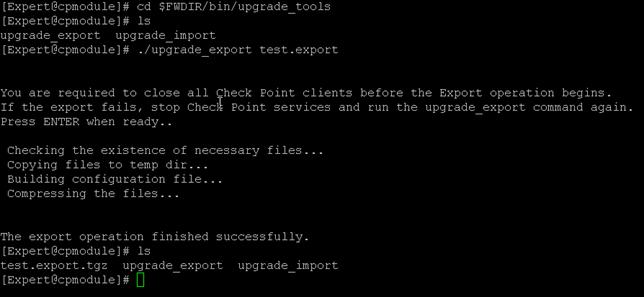
To export:

cd $FWDIR/bin/upgrade_tools
./upgrade_export filename

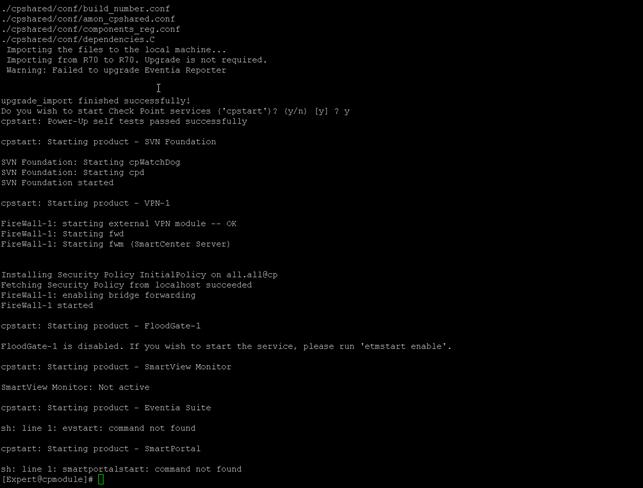
To import:

cd $FWDIR/bin/upgrade_tools
./upgrade_import filename

Note - upgrade_import will stop the services.

On Windows

To export:

cd c:/windows/fw1/bin
./upgrade_export filename

To import:

./upgrade_import filename

Additional backup issues

There are additional backup options that we recommend that you consider:

Database Revision Control

This utility creates a version of your current policies, object database, IPS updates, etc. It is useful for minor changes or edits that you perform in the dashboard.

It cannot be used to restore your system in case of failure.

To perform database revision control:

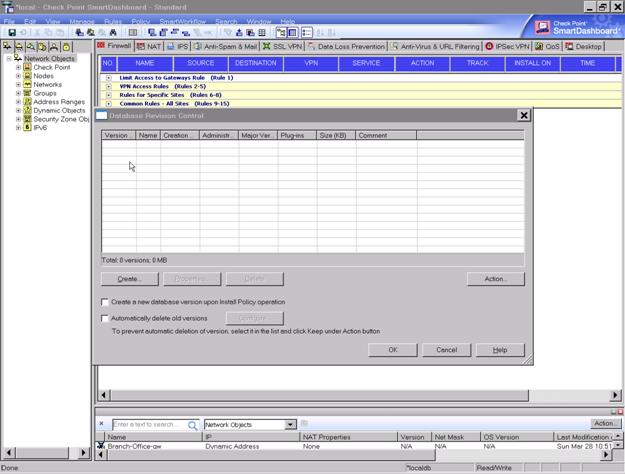
In the dashboard-> File ->Database revision control -> Create

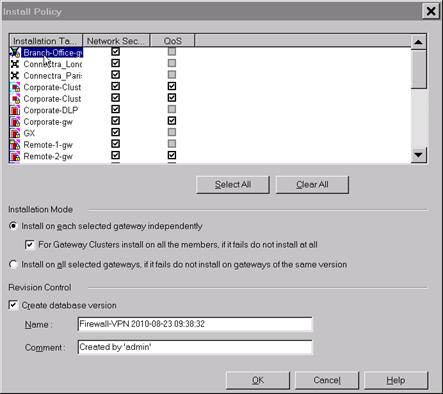
You can also create a version upon every policy installation.

Routing and interface information

This information is useful to have on hand as a reference if you are attempting to restore a configuration especially if your gateway module has a heavy routing table.

To create a copy of your routing and interface information:

netstat -rn > routes.txt
ipconfig -a > ipconfig.txt
ifconfig > ifconfig.txt
copy of /etc/sysconfig/netconf.C

Recommended backup schedule

  • Snapshot - at least once or before major change (for example: an upgrade), during a maintenance window
  • Backup - every couple of months, depending how frequently you perform changes in your network/policy. Also before every major change, during a maintenance window
  • upgrade_export - every month or more often, depending on how frequently you perform changes in your network/policy. Also important before upgrade or migration. Can be run outside a maintenance window.

Verifying the procedure

We always recommend to periodically test you backups for possible corruption issues or just to practice the restore process.

For this purpose, it is not possible to use snapshots. However you can use backup and upgrade_export.

Best practices Checkpoint Provider-1

1. MLM and MDS server recommended to place in firewall protected segment.

· This is to ensure those Provider-1 servers are available and not flooded with broadcast traffic.

2. Traffic between MLM, MDS and all gateways recommended to route through high consistent network paths.

· This is to ensure smooth communication between the devices, due to which we can reduce the load on the firewall modules(if the CMAs are not reachable due to any of the reason firewall gateways start logging to their local hardware, this is may increase resource utilization on firewall gateways.)

3. Scheduled backups of MDS primary and backup servers.

· This is to ensure that we have most appropriate backup all the times to rebuild the servers in case of any server hardware failure.

4. Scheduled fail-over test between MDS servers and CMAs.

· This is to ensure all the configuration is getting replicated across the servers.

5. Scheduled server hardware refresh (reboot).

· This is to ensure the server hardware is capable enough to handle any intended system reboots.

6. Scheduled manual HDD space monitor.

· This is to ensure that sufficient HDD space available for the application to run smoothly.

7. Schedule backups of MLM log files and file system.

· Due to this we can ensure that we have logs for the specific period of time.

8. Backup of entire file system of the server before any OS / Application patch or upgrade.

· This is to ensure quick revert back of the server.

9. Scheduled removal/cleaning of unused objects and unused rules for the global rulebase as well as on each of the CMAs rulebases.

· This is to ensure to keep Provider-1 database optimized and for improving the gateway performance as well.

10. Load sharing of CMAs across MDS servers.

· This ensures effective utilization of server hardware, due to which the response of the application is improved.

11. ICA (Internal Certificate Authority) expiry verification of all gateways, CMAs and MDS.

· This is to ensure Provider-1 infrastructure running smoothly.

Check Point logging issues when the Management Server is not receiving logs from the Modules : sk40090

Solution

The following article is a list of steps one should go through when troubleshooting logging related issues in a distributed setup.

1. Ensure that you have not run out of disk space on the hard disk that the logs are being sent to. If this is the case, delete or move the logs to an external storage device.

2. Is there communication between the MS and the Module? Test using ping to the MS from the module and then from the Module to the MS (your rules must allow for this). If this fails, and your rules allow for this, then it is most likely a routing issue.

3. Check to see if the fw.log file is growing on the module. It should be if the logs are not going to the MS. From the console run these commands:

cd $FWDIR/log

ls -la

ls -la

Verify that the fw.log file is increasing. If it is increasing then the modules are logging locally instead of forwarding the traffic to the MS. This could be a connectivity issue, or it could be the way the logging is setup. Check the FW object to ensure it is setup to send logs to the MS.

4. Can you fetch a policy? Verify that you can fetch using the hostname and IP address. If this fails then you probably have a SIC issue. To test this run the following commands:

fw fetch hostname_of_MS

fw fetch IP_Addr_of_MS (fetch by IP address also to ensure it is not a DNS issue)

5. Check the masters file. The hostname or IP address of the management station should be listed in there. To check this run the following commands:

cd $FWDIR/conf

cat masters

It should be look like this:

[Policy]

hostname_of_MS

[Log]

hostname_of_MS

[Alert]

hostname_of_MS

6. Run tcpdumps on the module, listening for port 257 on the interface facing the MS, to see if it is attempting to send logs. To check this run the following command:

tcpdump -i eth-facing-MS port 257 (use the Ctrl+C to break out of the dump)

You should see traffic leaving the FW and heading to the IP address of the MS.

You should also see traffic coming back from the MS.

7. The log file may have gotten corrupt. Run a log switch on the MS and reboot the MS to create a new log file. If logswitch does not work, move all contents of the log directory (do not move the directory itself) to a temp folder outside of the log directory. Reboot and see if the logs start again.

8. Delete the $FWDIR/log files and $FWDIR/state directory files on the module; reboot the module.

Reboot and see if the logs start again.

9. Look to see if there is a listening port for logging. Run the following command on the MS and the module:

netstat -na

You should see the *.257 LISTEN for logging connections. You should also see the IP address of the MS :257 associated with the IP address of each module, and showing an ESTABLISHED connection.

10. Check the log settings for the FW object and make sure the 'Log Server' is set to the MS that should be receiving the logs. This is usually done by default, but may have been changed by a user.

If after going through these steps you are still experiencing logging issues, please open a ticket with Nokia TAC for further troubleshooting.

Checkpoint : Nokia Hardware - Model - Serial Number

FW [Admin]# cat /var/etc/.nvram
Vendor Nokia
Chassis serialnum: 93064000318
Model IP560
FW [Admin]#

TCP DUMP - Deep Inside

Running the tcpdump utility
====================

Following are examples of commands used to run the tcpdump utility:
Selecting an Interface or VLAN

The tcpdump utility is able to sniff for packets on only one interface or VLAN. By default, it will select the lowest numbered interface.

To select an interface, use the -i flag as follows:

tcpdump -i

For example:
tcpdump -i exp1
tcpdump -i 1.10
tcpdump -i internal

Disabling name resolution

By default, tcpdump will attempt to look up IP addresses and use names, rather than numbers, in the output. BIG-IP must wait for a response from the DNS server, so the lookups can be time consuming and the output may be confusing.

To disable name resolution, use the -n flag as in the following examples:

tcpdump -n
tcpdump -ni internal

Saving tcpdump output to a file

You can save the tcpdump data to one of the following file formats:

• A binary file that contains all the information collected by the tcpdump and is readable by the tcpdump utility as well as many other traffic analysis packages.
• A text file that contains a subset of the full tcpdump data, but is readable only as plain text.
Binary file

To save the tcpdump output to a binary file, type the following command:

tcpdump -w

For example:

tcpdump -w dump1.bin

Note: The tcpdump utility will not print data to the screen while it is capturing to a file. To stop the capture, press CTRL-C.

Text file

To save the tcpdump output to a text file, type the following command:

tcpdump >

For example:

tcpdump >dump1.txt

Reading tcpdump binary file output

To read data from a binary tcpdump file (that you saved by using the tcpdump -w command), type the following command:

tcpdump -r

For example:

tcpdump -r dump1.bin

In this mode, the tcpdump utility reads stored packets from the file, but otherwise operates just as it would reading from the network interface. As a result, you can use formatting commands and filters.

Filters

The tcpdump utility allows you to use filters to, among other things, restrict the output to specified addresses and ports and specified tcp flags.

Filtering on a host address

• To view all packets that are traveling to or from a specific IP address, type the following command:

tcpdump host

For example:

tcpdump host 10.90.100.1

• To view all packets that are traveling from a specific IP address, type the following command:
tcpdump src host

For example:

tcpdump src host 10.90.100.1

• To view all packets that are traveling to a particular IP address, type the following command:
tcpdump dst host

For example:

tcpdump dst host 10.90.100.1

Filtering on a port

• To view all packets that are traveling through the BIG-IP system and are either sourced from or destined to a specific port, type the following command:

tcpdump port

For example:

tcpdump port 80

• To view all packets that are traveling through the BIG-IP system and sourced from a specific port, type the following command:

tcpdump src port

For example:

tcpdump src port 80

• To view all packets that are traveling through the BIG-IP system and destined to a specific port, type the following command:

tcpdump dst port

For example:

tcpdump dst port 80

Filtering on a tcp flag

• To view all packets that are traveling through the BIG-IP system that contain the SYN flag, type the following command:
tcpdump 'tcp[tcpflags] & (tcp-syn) != 0'

• To view all packets that are traveling through the BIG-IP system that contain the RST flag, type the following command:
tcpdump 'tcp[tcpflags] & (tcp-rst) != 0'
Combining filters with the and operator

You can use the and operator to filter for a mixture of output.

Following are some examples of useful combinations:

tcpdump host 10.90.100.1 and port 80
tcpdump src host 172.16.101.20 and dst port 80
tcpdump src host 172.16.101.20 and dst host 10.90.100.1

Capturing Packet Data

The tcpdump utility provides an option which allows you to specify the amount of each packet to capture.

You can use the -s (snarf/snaplen) option to specify the amount of each packet to capture. To capture the entire packet, use a value of 0 (zero). For example:

tcpdump -s0 src host 172.16.101.20 and dst port 80

Alternatively, you can specify a length large enough to capture the packet data you need to examine. For example:

tcpdump -s200 src host 172.16.101.20 and dst port 80

If you are using the tcpdump utility to examine the output on the console during capture or by reading from an input file with the -r option, you should also use the -X flag to display ASCII encoded output along with the default HEX encoded output. For example:

tcpdump -X -s200 src host 172.16.101.20 and dst port 80

Supressing hostname and port resolution

The tcpdump utility provides an option which allows you to specify whether IP addresses and service ports are translated to their corresponding hostnames and service names.
Since performing multiple name lookups during a packet capture may be resource intensive, you should disable name resolution while capturing on a busy system using the -n option. For example:

tcpdump -n src host 172.16.101.20 and dst port 80

Service port lookups incur less overhead than DNS-based name resolutions, but still are usually unnecessary while capturing. You can disable both name and service port resolution while capturing by using the -nn option. For example:

tcpdump -nn src host 172.16.101.20 and dst port 80

Combining tcpdump options

This Solution contains the most essential tcpdump options. You will generally need to use most of the options in combination.

Following are examples of how to combine the tcpdump options to provide the most meaningful output:

tcpdump -ni internal -w dump1.bin
tcpdump -ni internal -r dump1.bin host 10.90.100.1
tcpdump -ni exp1 host 10.90.100.1 and port 80
tcpdump -ni 1.10 src host 172.16.101.20 and dst port 80 >dump1.txt
tcpdump -Xs200 -nni eth0 -w /var/tmp/mgmt.cap dst host 172.16.101.20 and dst port 162

R75 was released!

The brandnew R75 version was released Day before yesterday.

Check out the info page with all the relevant information!

Check Point's New Software Blade Licensing Model Architecture

Background

With the R70 release of Check Points security gateway and management platform imminent, the venerable security vendor has seized the opportunity to make changes to its licensing model. The beloved UTM and Power software product lines are being gradually replaced with what they are referring to as the Check Point Software Blade Architecture. So what is it?

Lets start with a little history. Check Point's Security Gateways (aka firewalls) have always been feature rich, supporting many different functions (SSL VPN, Remote Access VPN, Site to Site VPN, Firewall, NAT, IPS, Software Acceleration, QoS, Web Application Firewall, Dynamic Routing, Clustering... the list goes on). Because of this, the Check Point license enforcement mechanism is equally rich and flexible (i.e. cp.macro* plus the associated code) which allows the vendor to create a myriad of licenses. For example, the software infrastructure is available to license things from the Database Revision Control feature of the GUI to the support for NAT on the Gateway, although Check Point license these features, and always have, as part of the SmartCenter and Gateway respectively.

This new architecture allows the most important of the many features are represented by a conceptual component called a Software Blade with each different type of Blade offering a different feature. The software blades are portable amongst security gateways so for example, if you have a gateway that has changed roles from a perimeter device to an internal device, and no longer terminates VPNs, you can remove it's VPN software blade and place it into another gateway much in the same way as you can move a hardware blade from one chassis into another. The metaphor is a good one.


Gateway Software Blades - Giving your Gateway it's Security Features

There are Software Blades available which will activate the following features:

Firewall, VPN, IPS, Acceleration & Clustering, Advanced Networking, Anti-Virus, Anti-Spam, VoIP Security and finally Web Security. Although the Acceleration & Clustering and Advanced Networking Software Blades appear to be new, they are in fact a combination of four existing features:

Picture 17


If you work for a Check Point reseller you should immediately recognize most if not all of the features mentioned so far. The Firewall, VPN & IPS come from the core gateway product since the Express/Pro line, the Anti-Virus, Anti-Spam & URL Filtering are taken from the VPN-1 UTM product, and the Acceleration and Advanced networking from the Power product. As a result they are all neatly split up into to separate parts that can be licensed in a piece meal fashion. The customer can buy what he needs, not more, not less.

You can see an example of a Check Point Gateway fitted with all of the currently available Software Blades. The only Software Blade that might make you look twice is the VoIP Security. It's not my place to explain this however you should review the R70 'What's New' document when it's available.

Picture 5


Gateway Containers - Giving the Gateway it's Multi-Core support and User Count

What's also vital to point out is the gateway container. You need to purchase a Container before any of the blades become useful, and it's the container that governs how many cores and how many users the gateway will support. Some containers come bundled with many Software Blades, some come with only the Firewall Blade.

They are available in the following varieties:

SG80x - 8 cores / unlimited Users

SG40x - 4 cores / unlimited Users

SG20x - 2 cores / 500 Users

SG10x - 1 core / 25 users

I'll discuss what the x stands for in a moment, however, we can see that the first number simply reflects the number of cores and users the gateway will support.

You'll notice less variety in the available user counts versus the previous price list. 1 core container will only support up to 25 users and the2 core container, 500 users. This is a major change. We've lost the granularity of the old licenses which were available in brackets of 25, 50, 100, 250, 500 & of course Unlimited.


Putting it all together!

Now lets talk about the pre-populated, Containers. These are effectively bundles of a Container and the most commonly used Software Blades and closely resemble the products from the previous UTM/Power price list.

Picture 11

We clearly understand what the first number in the new Software Blade Gateway Bundles indicates, but what about the third number (the second number is always zero - so we'll skip it here)? Well, it simply tells us the initial number of software blades that are included in the bundle. In essence the bundles are made up of one or more of three different components which I've grouped under somewhat familiar names. (Remind yourself that the ACCL Blade includes SecureXL and ClusterXL, and the ADN Blade includes QoS and Dynamic Routing).


A picture is worth a thousands words:

Picture 14


Firstly we can see that the x06 at the top provides the same features as the previous VPN-1 UTM product but it's only available as a the single core/25 user SG106. We've no matching product in the 2xx, 4xx & 8xx series. This in my mind makes sense, as it omits the SecureXL Acceleration feature (included in the ACCEL blade) which could not accelerate UTM inspected traffic so the customer is unlikely to need it. In addition, a 25 user site would not need to scale it's gateway performance using a Load Sharing Cluster (again included in the ACCL blade); a High Availability Cluster would suffice, and so the omission of the ACCEL blade does the product line no harm.

Moving up, we've got the x05 (as a SG205 in this in this example). This is, feature wise, a VPN-1 Power product with the addition of Dynamic Routing (SecurePlatform Pro) and ClusterXL Load Sharing as part of the ACCEL and ADN blades.

Second to last, we've got the x07 which is the equivalent of the 'fully loaded' VPN-1 UTM/Power product but again with the addition of Dynamic Routing and ClusterXL Load Sharing included in the ADN and ACCL respectively.

Last but not least is another x05 this time in 8 core U user SG805 variety. This is the high performance FW/VPN/IPS gateway including SecureXL software acceleration, and 8 cores of packet processing wonderment! Again, 800 series is limited, this time to only the x05. I believe this makes sense as an 8 Core Gateway with no SecureXL Acceleration does not optimize the potential of the machine as a gateway. (In fact, the usefulness of the SXL feature depends on traffic mix, and the use of the IPS and 'UTM' features).

What's unclear at the time of writing is whether or not a blade from a bundled product can be removed from the container or not. If you have the answer, put it in the comments!


Roll Your Own (Firewall)!

Whilst the Gateway Bundles are great, they might give you more feature than you actually want. If this is the case you are able to create a completely customized gateway with only the feature your need for your business starting off with a x01 container as below.

This addresses one of the major pain points for user buying Check Point software. You might have heard it before: "I don't want to pay for features that I am not using!". With the previous price list, even the most inexpensive gateway was bundled with VPN and IPS features which put off the customer who only wants a firewall.

Essentially you have three steps in building your own bespoke Security Gateway:

1. Choose the number of cores and users you wish the gateway to support.

2. Choose your Software Blades.

3. Make your purchase.


Now lets look at an example. Yes, it's story time!

Picture 16

Here we have a Gateway that is going to be placed on the perimeter of a 300 user office and it'll run on a lovely new HP quad core box. We've already got a stand-alone IPS product from Check Point, and have decided that we don't need the Security Gateways IPS feature. Also there is another device terminating VPN connections so we'll not need this in the gateway either. Rather than waste cash on features we won't use, we purchase a SG401 container which only includes a Firewall Software Blade and provides support for our quad-core box.

After the Gateway was put in place maintenance on our URL filtering and Anti-Spam solution expired, so we purchased the ASPM and URLF blades to provide this feature on the gateway.

A year later, the CPU on the gateway was beginning to top out at 70%. After taking a look at the traffic, it was apparent that database replication was taking place through the Gateway and pushing the CPU% up. The ACCL blade was then purchased to provide SecureXL traffic acceleration. This brought the CPU down nicely.

Loss of Granularity in User Count

The user count change primarily makes the licensing easier to understand. In fact, the Software Blade concept in general is an improvement as there are a smaller number of licenses to choose from which removes a lot of confusion when putting together a solution. However, when we look at some of the lower user count licenses, for example the VPN-1 UTM 100 we find that there is no comparable Software Blade product. The closest is the SG106, which matches the features completely, but this is double the price of the VPN-1 UTM 100 and supports only 50 users.

Another example of the low end licenses loosing out is the VPN-1 Power 50. Here we have the SG103 that looks to be match. It has the same user count, core count, FW, VPN, and IPS feature, and is the same price. But the new SG103 drops the QoS and the SXL feature. If you wanted to add these features you would have to add the ACCL (Acceleration & Clustering) Blade and the ADN (Advanced Networking) Blade at $1,500 each. Bringing the total price up to $7,000 from $4,000.

Now, I don't think these cost rise on a few of the low-end products is intentional, I believe it's simply a side effect of the simplification of the licensing, something that all Check Point customers and partners have been hoping for. And if we look at the UTM-1 product line, we find that there are cost effective replacements for the smaller licenses in a hardware package which benefits the customer in that they need not purchase an Intel server to run the Check Point software.


A few Punchy Points

Here we'll briefly summarize the key changes between the old and new price list. It will not provide a complete differential, but will point you towards some of the changes that jumped out at us.

- ClusterXL (needed for Load Sharing Clusters) is less expensive: is now $1,500 as part of the Clustering & Acceleration blade. Previously $3,000 or $6,000 users per gateway. Also includes SecureXL which was previously $6,000.

- SecurePlatform Pro bundled with QoS for more value: was $1,500 for only dynamic routing. Is now $1,500 BUT includes both QoS and dynamic routing as part of the Advanced Networking Blade.

- Web Intelligence now sold as a Software Blade. No longer sold per protected server. Is now $1,500 regardless. Previously $5,000 for three protected servers, $10,000 for 10 protected servers, and $20,000 for Unlimited protected servers.

- SmartCenter UTM 5 site now the SM1003. BUT licensed based on gateways. Assuming clusters of two gateways, the product is identical.Was $10,000 is now $9,000.

- New SmartCenter (SM2500) for 25 gateways. Appears to be regular SmartCenter plus SmartView Monitor, SmartProvisioning (new R70 feature!), & IPS Event Analysis. No UTM/Power SmartCenter to compare this to.

- SmartCenter Power Unlimited is now more expensive as the SMU007. Was $22,000 is now $27,000. Appears to be missing SmartMap (my gut tells me it's been collapsed into one of the other blades, time will tell). SmartPortal is no longer included, and is a separate Software Blade. IPS Event Analysis & SmartProvisioning has been added however. Still includes SmartDirectory, SmartView Monitor (now part of the Monitoring Blade), and of course SmartView Tracker, SmartDashboard, & SmartUpdate (as part of Provisioning).

- Customer Logging Module appears to have become more expensive. Previously $1,000 now $5,000 as the SM1001. Only supports logging from 10 gateways also rather than the Unlimited as previously.


Summary

In this blog entry we took a brief look at Check Point's Software Blade Architecture and how it effects the purchasing of their software Security Gateway product line. Key points are as follows:

Container: Gives us the User Count, Core Count, and the Firewall feature

The containers remove the need for separate Multi-Core licenses (one less SKU on the pricelist!), and also take care of user count they are the basic foundation of a security gateway. They enable the Security Blades to be user count agnostic.

The x01 Firewall-only Containers keep the cost of the basic gateway low and give users what they've been asking for: a gateway that does only firewalling at a reasonable price (for a four core/unlimited user gateway the SG401 is $12,500 versus $16,000 for the U2 Power on the previous list).

Software Blades: Gives us the flexibility we need

With the Software Blades priced at $1,500 regardless of gateway user count or core count (excluding the Services Blades), adding additional features to your gateway is now as simple and a one line purchase order. I cannot overstate this. Previously it would involve either a 'trade in' or 'functionality upgrade' process, which was complex, and time consuming for both end user, reseller and Check Point themselves.

The portability of the software blades between gateways also means that you can 'drag' a feature from one gateway and 'drop' it on another, allowing customers to move an unused gateway feature to a gateway that really needs it, saving on cost.


Conclusion

All in all this is an improvement. Whilst the Management components seem to have had the biggest price changes, these may well provide good ROI to the customer in the form of the new Management features in R70. I can't wait to see them. The gateway changes appears to offer customers good value and the flexibility they've been requesting for a long while. I personally hope that this model stays with us for some time.

Search This Blog

Blog Archive

Total Pageviews